Tracking and visualize after the burning pytorch

This framework tracks the pytorch model:
- On
nn.Modulelevel - Down to the metrics/ features of all tensors, includes
- inputs/outputs of each module
- weight/grad tensors
- By minimal extra coding
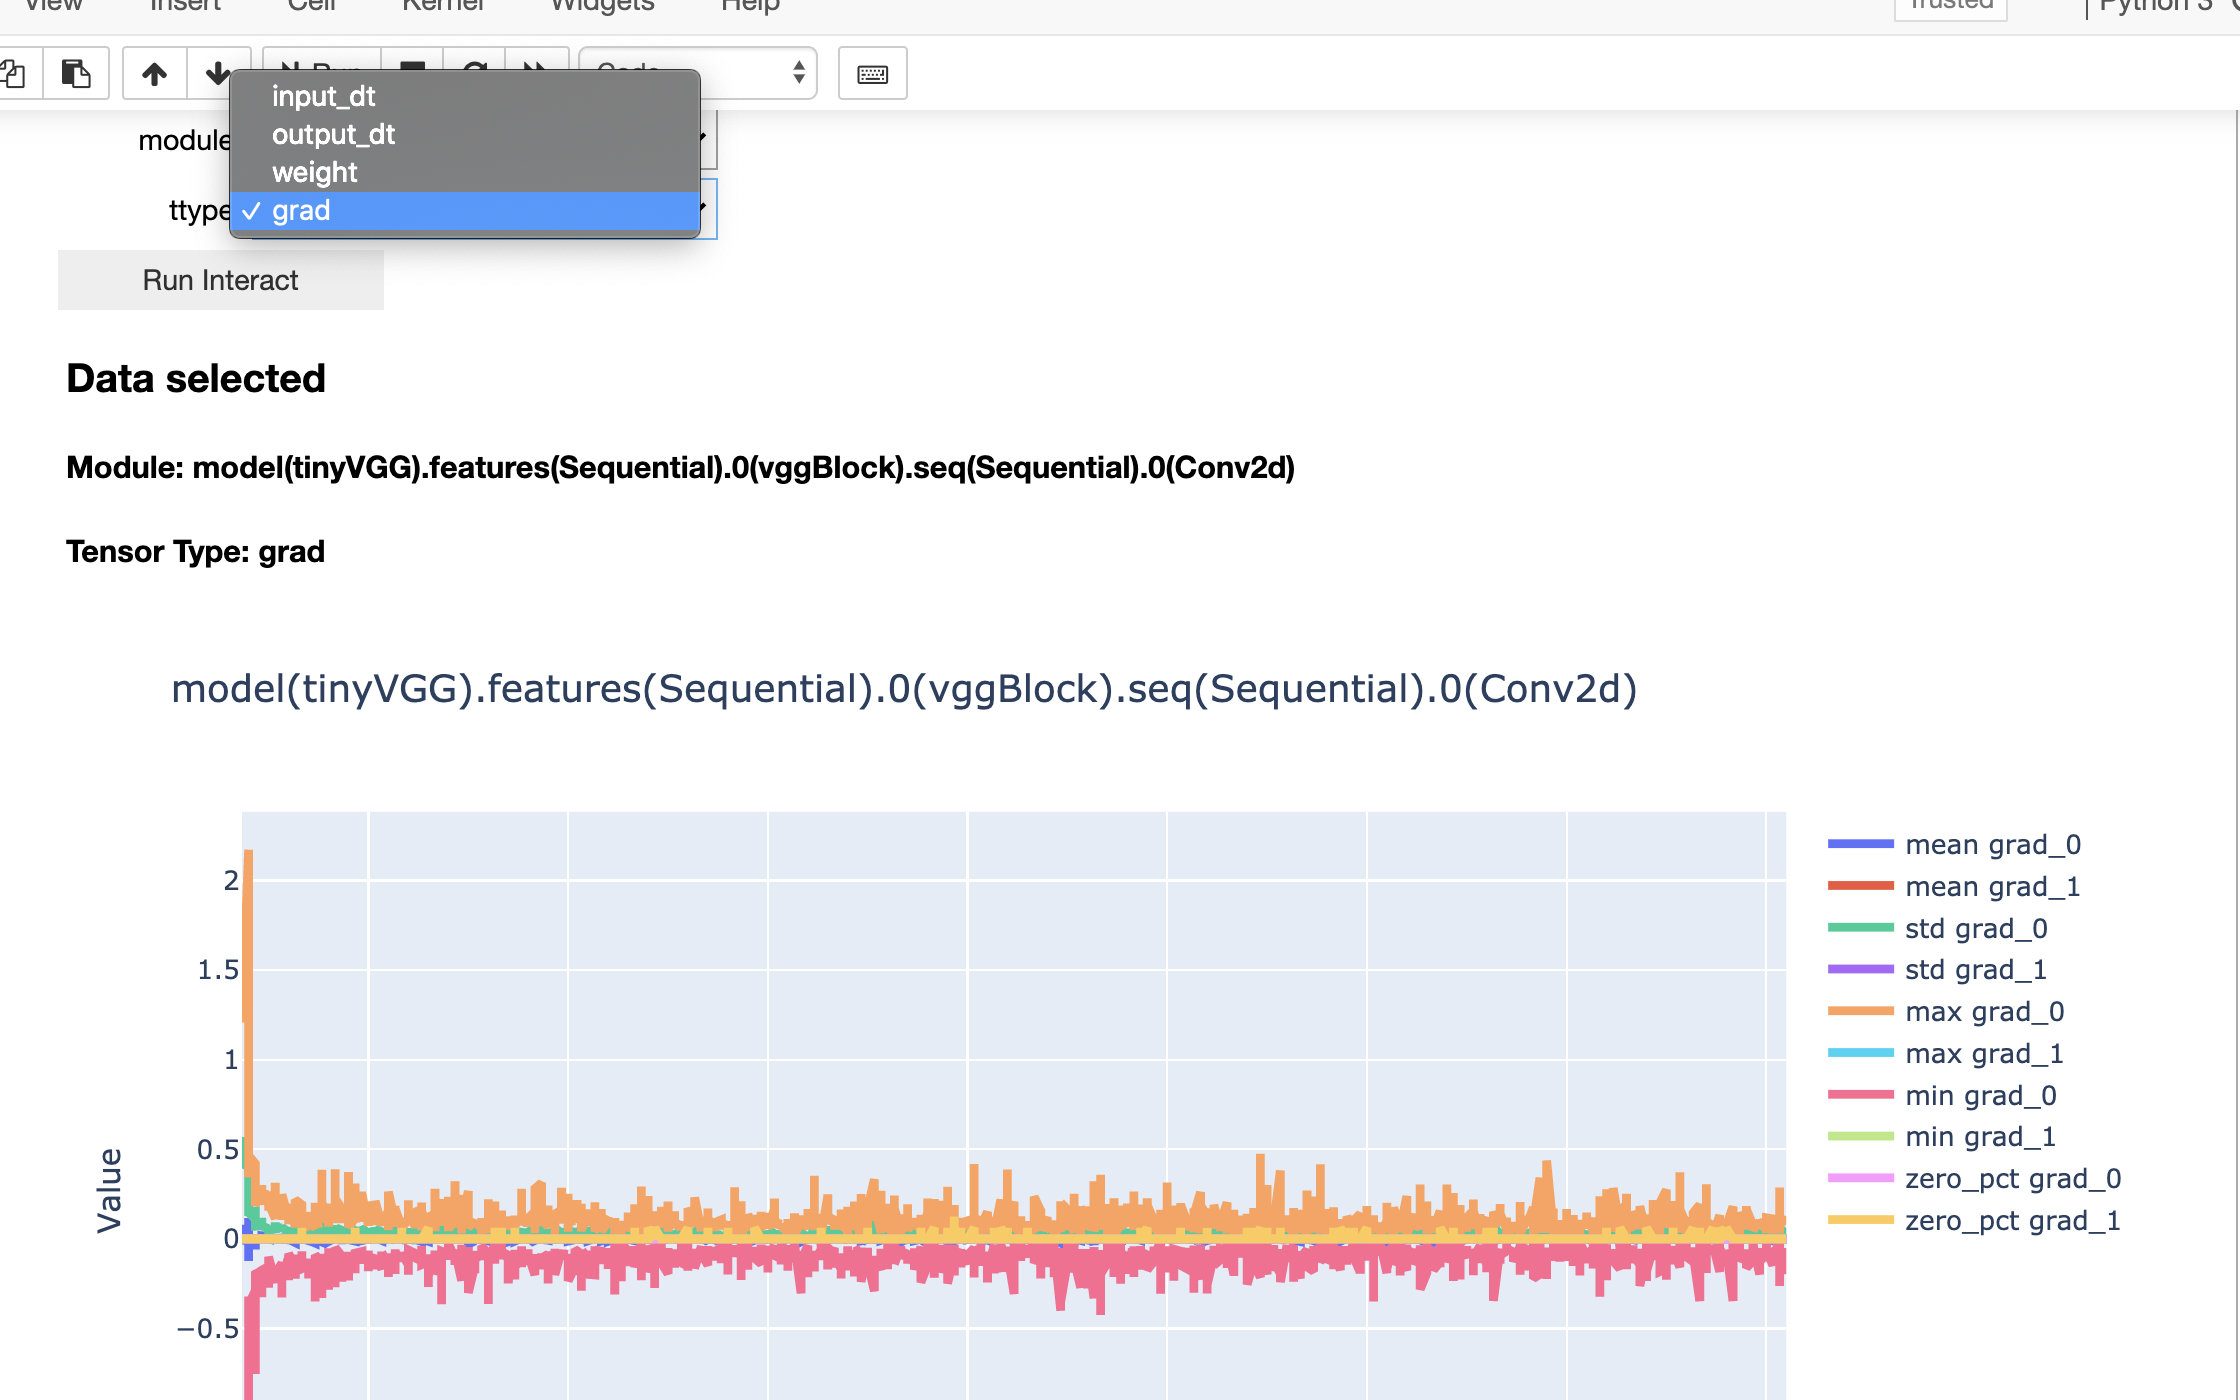
- Besides WebUI, Visualization compatible with notebook environment
Other lovely features
- Customizable metrics, with easy decorator syntax
- Split the tracking log in the way you like, just
mark(k=v,k1=v2...) - You can easily switch on/off the tracking:
- Even cost of computation is tiny, torchember don't have to calculate metric for every iteration
- Hence, you can track eg. only the last steps, only each 200 steps .etc
Installation
pip install torchember
Fast Tutorial
Step1, Track your model
Place you torch ember tracker on your model
from torchember.core import torchEmber
te = torchEmber(model)
The above can track input and output of every module,The following can track status of every module
for i in range(1000):
    ...
    loss.backward()
    optimizer.step()

    te.log_model()
Train your model as usual
Step2 Plan A, visualize in notebook
For colab, kaggle kernels, there isn't an option to run another service, you can visualize the result in notebook.
Of course the following is feasible in usual jupyter notebook.
from torchember.visual import VisualByTensor

vis = VisualByTensor()
- This extra line of code is for colab
vis.scatter_plot(vis.ember_sub_df)
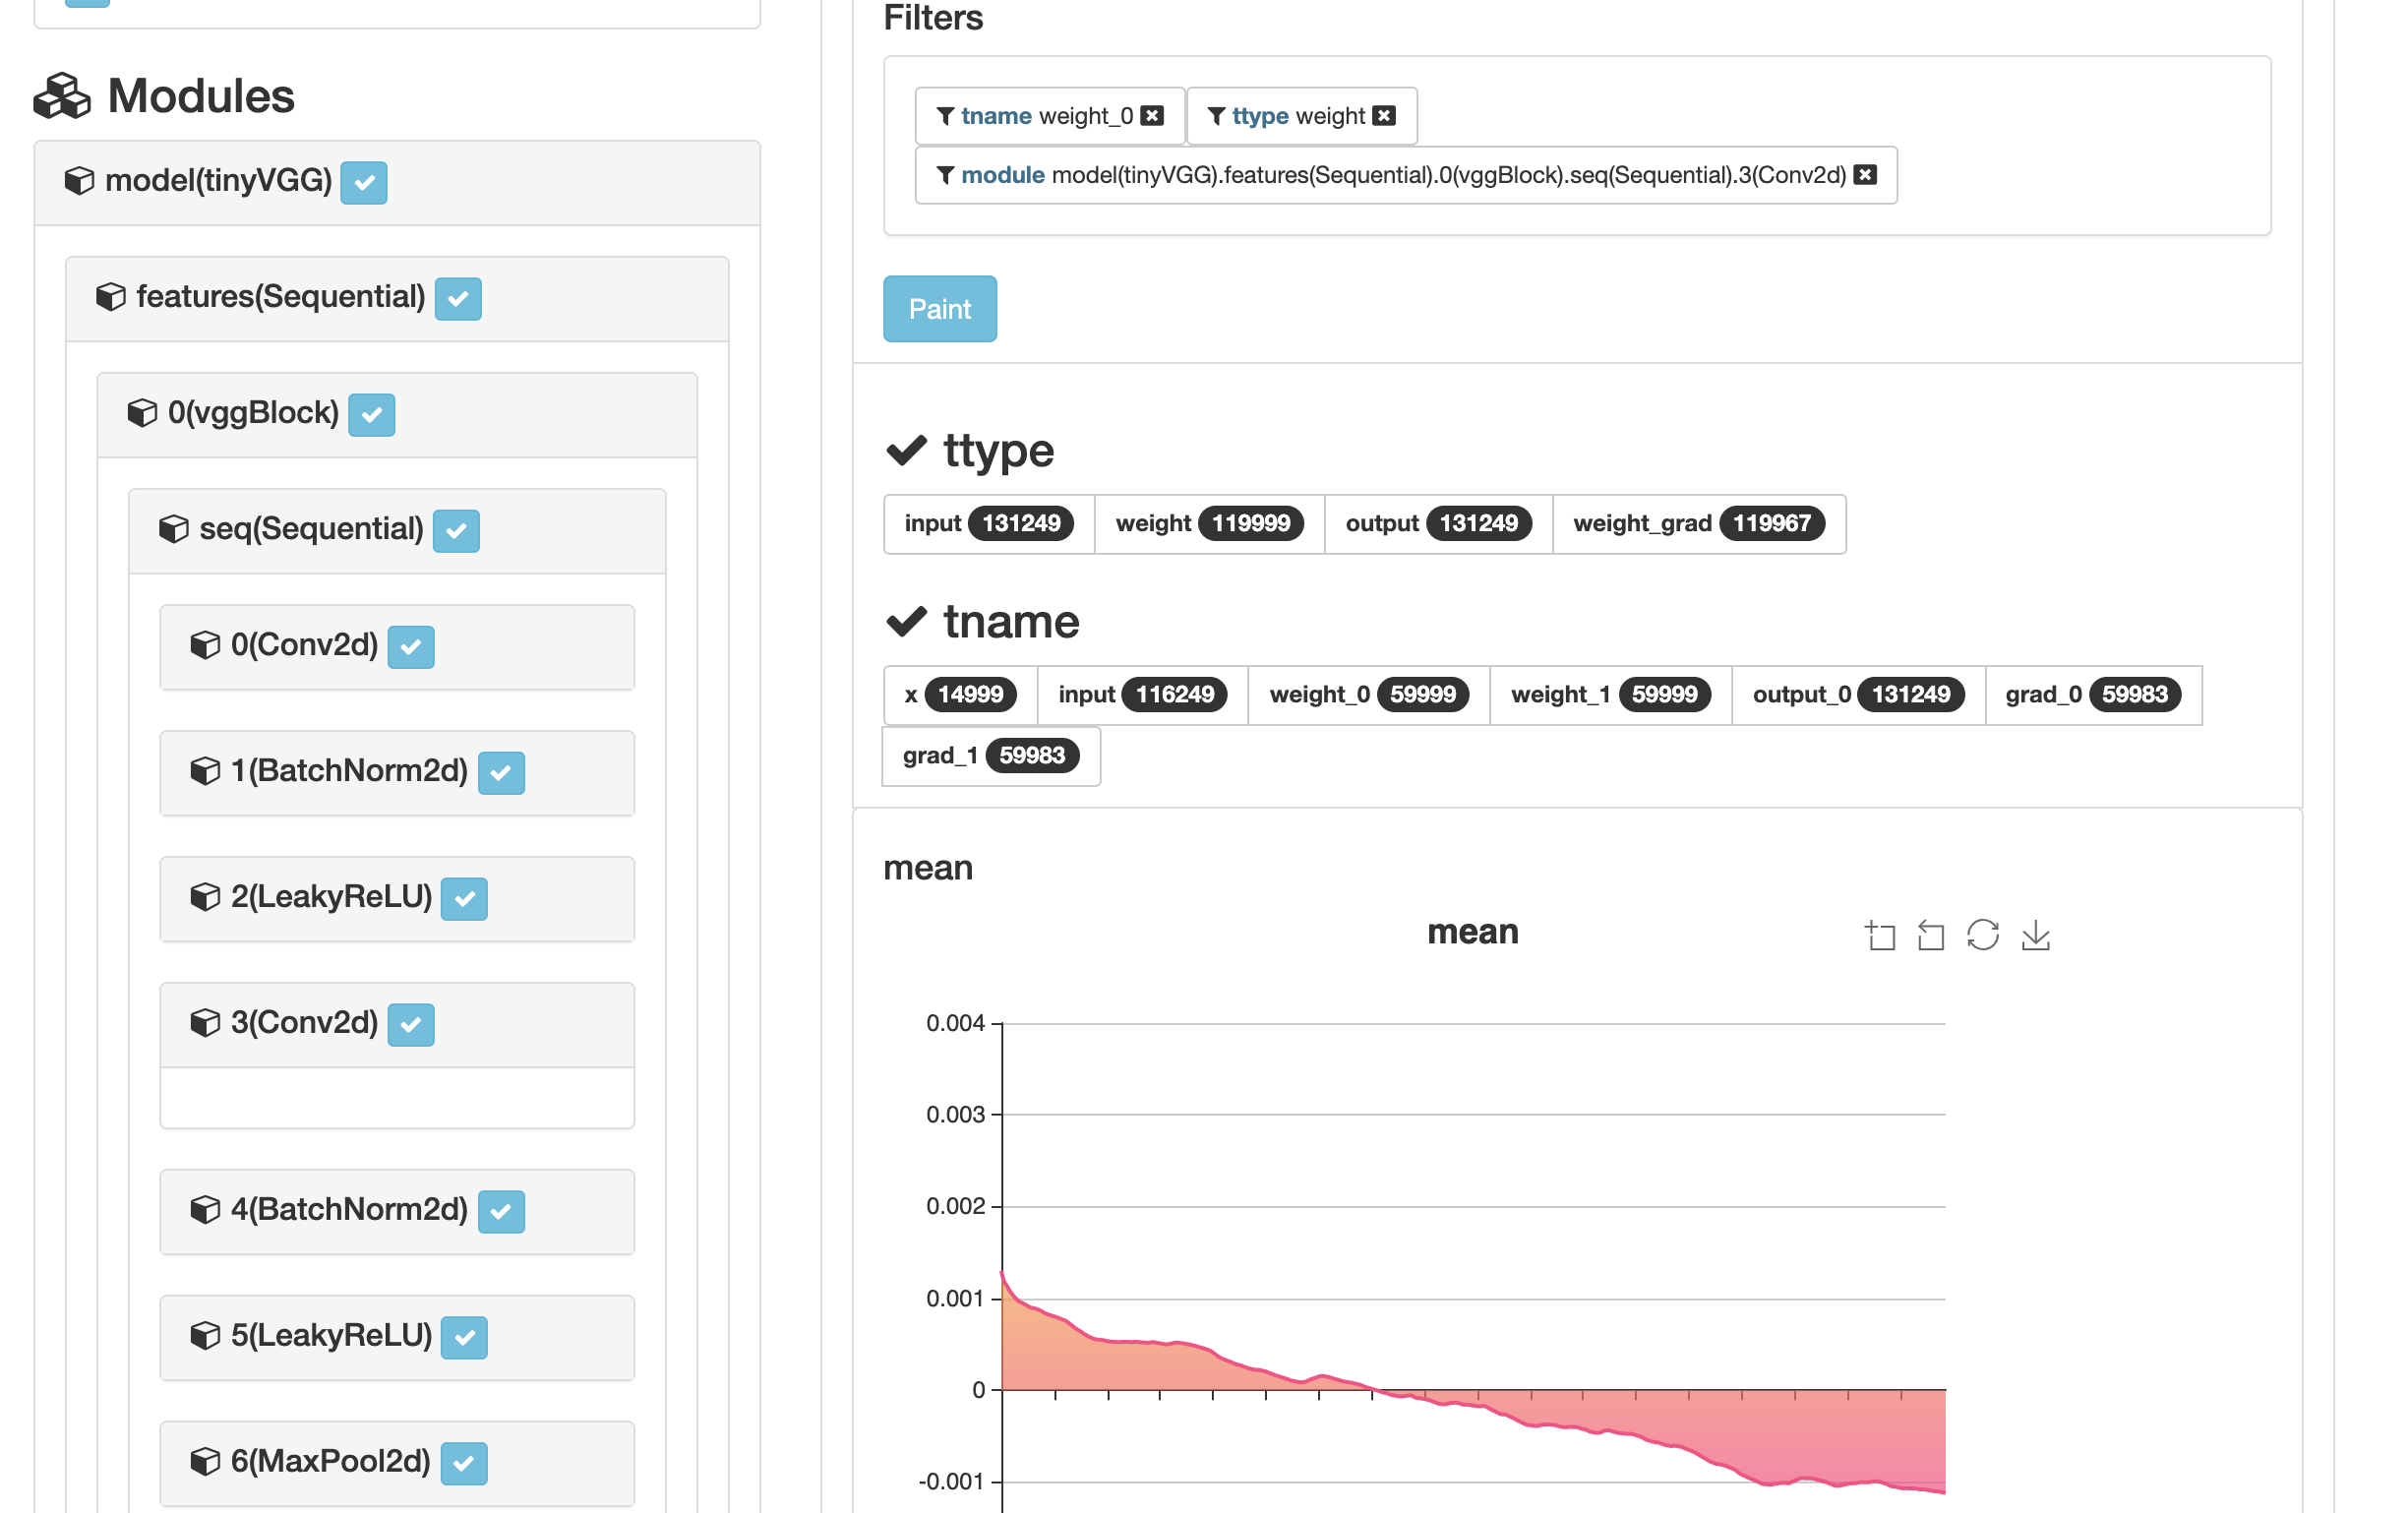
Step2 Plan B, Check the analysis on the WebUI
Run the service from terminal
$ torchember
The default port will be 8080
Or assign a port
$ torchember --port=4200
Visit your analysis at http://[host]:[port]

